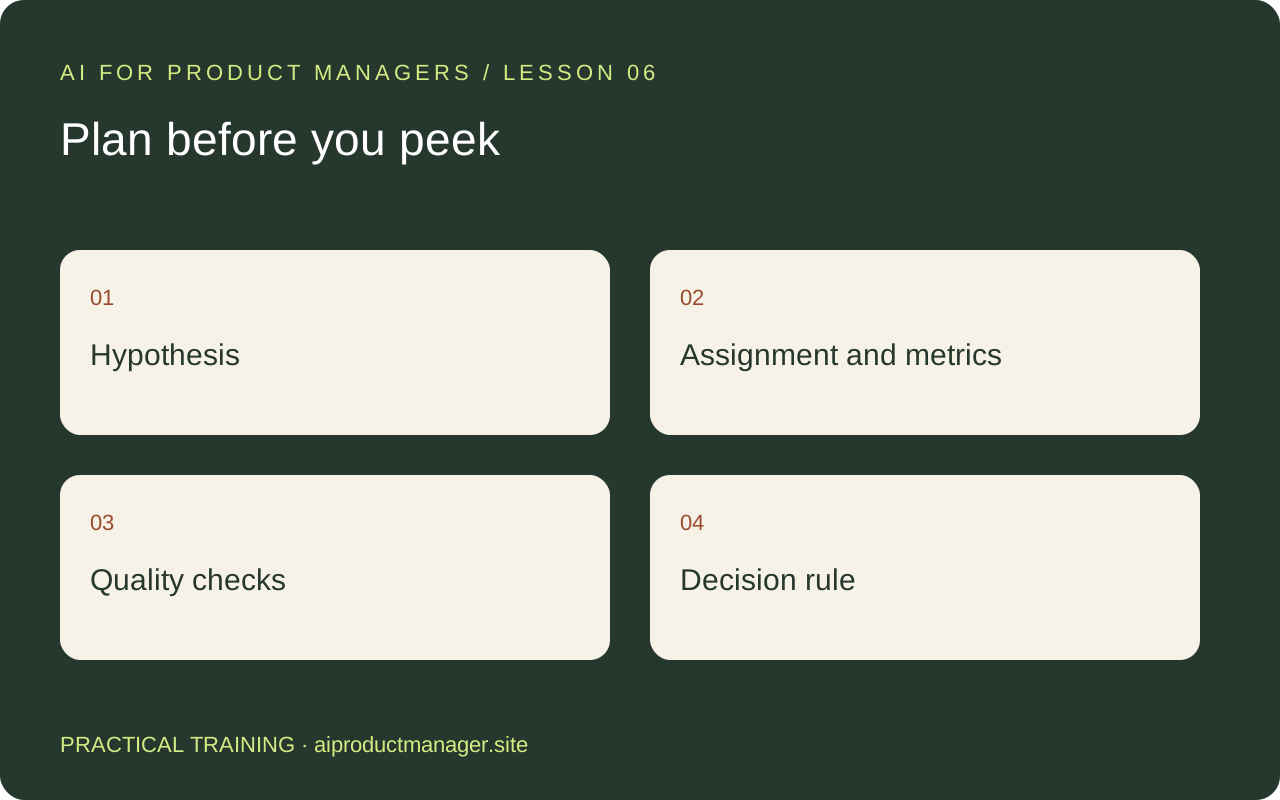
Use AI as an experiment assistant
AI can generate hypotheses, draft an analysis plan, inspect queries and help explain results. It cannot turn weak traffic into sufficient evidence or justify repeatedly checking a conventional fixed-horizon test until something looks significant. Keep the statistical design and product decision explicit.
Step 1: write a causal hypothesis
For our fictional appointment product: making available times easier to compare may increase completed first bookings. Define who is eligible, what changes and the expected mechanism. Avoid changing copy, pricing and flow simultaneously unless you deliberately want to test that combined intervention.
Step 2: define metrics and assignment
Choose one primary metric and define its numerator, denominator and measurement window. For example, eligible users completing a first booking within seven days divided by all eligible assigned users. Predefine assignment at user or account level and keep it stable. Watch for cross-device exposure and spillover between users.
Add guardrails such as cancellation rate, errors or support burden. Give each a measurement window and acceptable boundary. Distinguish guardrail metrics from secondary diagnostics.
Step 3: plan sample size and stopping
Use a suitable calculator or reviewed statistical code with your baseline, smallest practically meaningful effect, significance level and power. State whether the method is fixed-horizon or a valid sequential design. Fixed-horizon inference needs the planned stopping discipline; sequential analysis needs its own valid method. Do not mix them after seeing results.
Draft an experiment plan using only the supplied baseline and constraints. Define the causal hypothesis, eligibility, assignment unit, primary metric formula, guardrails, minimum worthwhile effect, required sample-size inputs and stopping rule. Mark missing values. Flag contamination, multiple comparisons and delayed outcomes. Do not invent traffic, calculate a sample size from missing inputs, or declare a winner.
Step 4: check data before effects
Verify exposure events, assignment persistence, deduplication and outcome windows. Investigate sample ratio mismatch: an unexpected allocation imbalance can indicate a broken experiment. Review bot traffic, exclusions and missing events using rules established before looking at outcomes. A large apparent lift does not rescue invalid measurement.
Step 5: explain results with uncertainty
Report sample sizes, baseline, absolute difference, relative lift, interval estimate, method and guardrail results. A hypothetical move from 10% to 11% is a one-percentage-point increase and 10% relative lift; this arithmetic says nothing about significance without sample sizes and a valid design.
Do not interpret “not statistically significant” as proof that variants are equivalent. Label underpowered results inconclusive. Investigate segments only with appropriate caution about multiple comparisons and exploratory analysis. Ask an analyst to review calculations and the final recommendation.
Low traffic: choose a better learning method
If the required sample cannot be reached in a useful period, consider moderated research, a concierge pilot or a larger meaningful intervention. These can answer different questions; they do not provide the same causal estimate as a randomized experiment.
Practice assignment
In 60 minutes, fill the linked experiment plan before generating variants. Include launch checks, stop conditions and a decision table for ship, revise or inconclusive. Read the site's product metrics guide for additional measurement and stopping-rule guidance.